Plausible Analytics is a simple, lightweight, open source and privacy-friendly web analytics tool. We’re a SaaS startup with subscriptions as a business model.
This post is a look at metrics we care about when analyzing our website, product and marketing efforts.
We eat our own dog food and use Plausible Analytics itself to do all our analysis. There are no other analytics scripts installed on our site. You can see our open stats dashboard with all the same data that we have access to.
- Do you need web analytics at all?
- What can web analytics tell a site or business owner?
- Most important web analytics metrics that we monitor
- Other web analytics metrics definitions
Do you need web analytics at all?
Some site owners don’t use any analytics as they are not interested in knowing the results of their efforts. They run a website because they want to or publish content on topics they want to more like a diary and they don’t worry whether someone visits that content or whether people like a particular topic more than another. That’s fantastic.
On the other hand, majority of website and business owners want to see some level of stats that tells them what’s going on, whether their efforts are resulting in anything and what exactly works and what doesn’t. There are many website analytics options for them.
What can web analytics tell a site or business owner?
There is no definitive answer to this question. Which metrics to use to measure the success of your website really depends on the website itself and the goals the site owner has with the website.
In this post, we will try to showcase the metrics we use ourselves and what we use them for. These are some of the main areas where web analytics can help website owners get a better idea of what’s happening and how things are going:
Is the website growing
This is one of the most important areas overall. Are people visiting your website in the first place? How does the visitor trend look like over a longer period of time? This gives you the answer to the question whether your website alive but also whether it is growing or declining.
This can help you understand which of your communication and marketing activities make a difference to your site. You may be putting a lot of time, effort and resources into different marketing campaigns and by looking at referral sources of your website traffic you can better understand which of those campaigns are more worth than others.
What are people doing when they visit the website
This tells you more about the different areas, sections and pages of your site. You’ve put a lot of time and effort to create those pages and web analytics can tell you which of them are attracting visitors. Metrics such as page views, bounce rate and visit duration can show you which of your pages are more useful and interesting and which are not.
This can help you understand which of your efforts are working better than the others. This can help you better allocate your future time and efforts to do more of the things that work and that your audience is interested in.
Are the visitors converting on the goals
Most web analytics allow site owners to set goals and events to track those visitor actions that matter the most to them. Examples of this can be anything from the number of visitors who sign up to a mailing list, to things such as the number of people who sign up to a trial account or the number of visitors who buy a product.
In many cases, goals and events can be tied directly to the monetary success of an enterprise which makes them essential metrics to follow to understand the state of the business.
Most important web analytics metrics that we monitor
Here’s the list of the most important metrics that we monitor to understand the progress we’re making as a startup.
Unique Visitors
The number of people who visited your site. This is important to understand your acquisition and whether you’re actually getting any new people to come to your site.
We look at unique visitors as an overall, top-level indicator of what’s happening. You want to see your site growing and attracting an increasing number of people. So a quick look at the number of unique visitors with a comparison to the previous period is a great place to start.
But it’s also worth noting that things are not always that simple. If you have a large spike of traffic because one of your posts goes viral, it is only natural that you will see a big drop in unique visitors in the period after.
Accept that short term traffic fluctuations are normal and wait for more long-term trends to emerge before making any drastic decisions. Tracking metrics and understanding trends over a longer period of time is the key.
Tracking unique visitors without cookies
The definition of unique visitors is a bit different in Plausible Analytics compared to a cookie-based analytics tool. Plausible Analytics is privacy friendly tool so we don’t use cookies and any other persistent identifiers to keep track of visitors.
If a person visits your site from multiple devices or on multiple days, they are counted as separate visitors. This allows us to be compliant with the different privacy regulations such as PECR and GDPR so you don’t need to get the visitor consent to keep track of the stats.
You can learn more about how we count unique visitors.
Referral Sources
See all referral sources that are sending you traffic. A source is reported when a person clicks through to your site from another site.
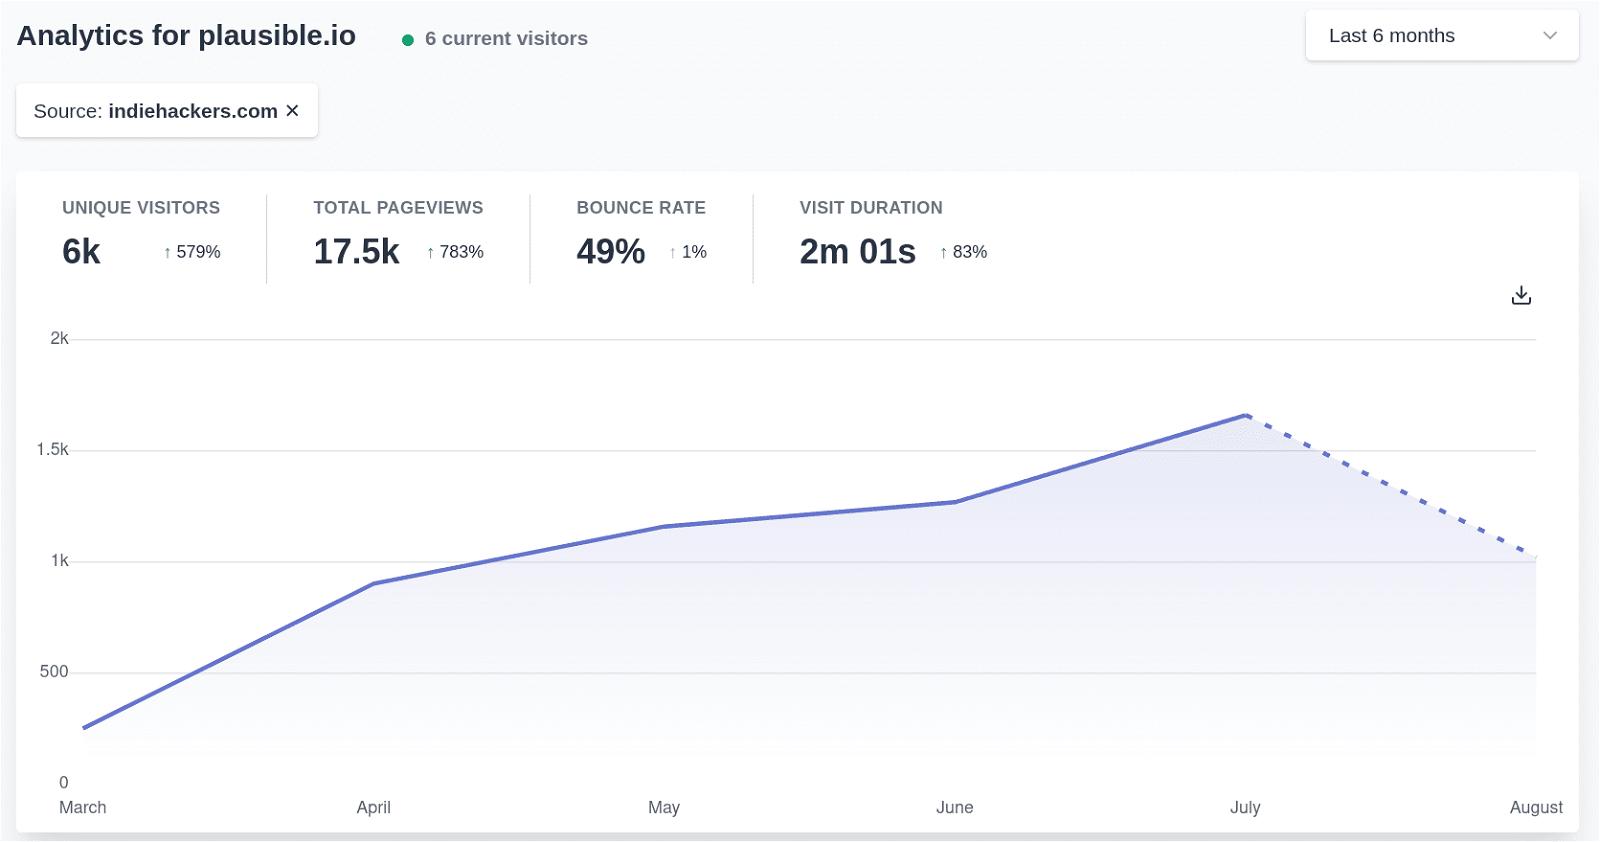
In Plausible Analytics, you can click on any source to drill-down and view the individual referrers linking to your site and the traffic they’ve sent over time.
This is especially useful if you want to understand your marketing activities in depth. Here’s a look into referral traffic sent from Indie Hackers, one of the communities we engage on a lot:
This can help you understand the effectiveness of your actions. If you’re spending a lot of time and effort on a community but that effort doesn’t result in any benefits to your site or business, then you need to reconsider things.
Either change the way you approach the particular community or see if there are other communities that may be more appropriate to you.
How to use bounce rate and visit duration to analyze referral sources
On our own website over the last six months, Google and Facebook have sent a similar amount of referral traffic (Google 7.2K and Facebook 6.4K visitors). Without looking at other metrics, you may think that they are equally useful sources of traffic.
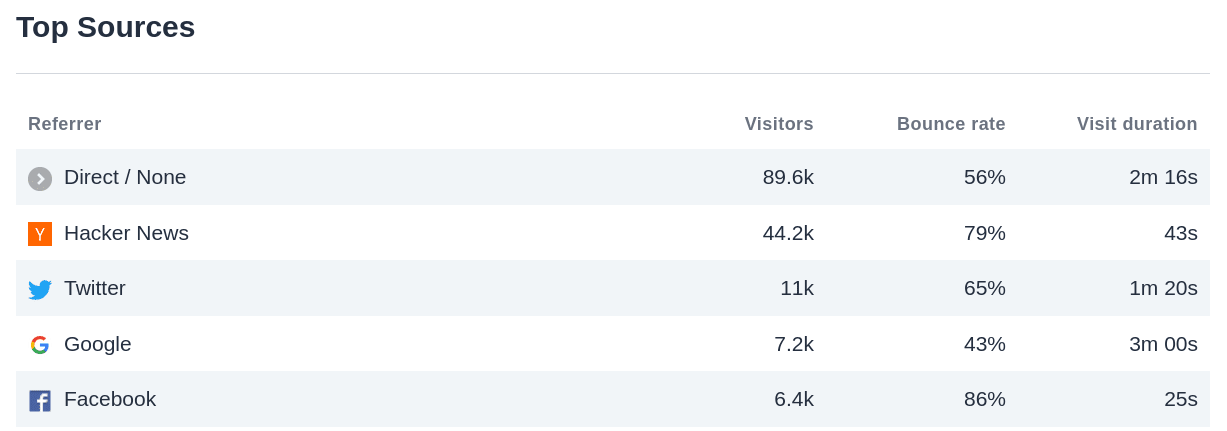
But if you add bounce rate and the visit duration into the equation, you can then see a big difference in quality.
Google traffic bounce rate is at 43% and visit duration is at 3 minutes which makes it one of our top traffic sources. Facebook, on the other hand, bring lower quality traffic. The bounce rate is 86% and the visit duration is 25 seconds.
It doesn’t necessarily mean that Facebook is a bad traffic source but it does show that things are not exactly what they seem on the surface and that a closer look is needed to get more actionable insights.
Google Search Queries
Google and other search engines are top sources of quality traffic for many websites and startups. Looking deeper into the organic traffic from search engines is a valuable exercise that can help drive your future strategy. Some things that are worth keeping an eye on:
The overall level of organic search traffic
The overall level of traffic from Google search (or other search engine that drives the traffic to your site). You want this number to be rising as you continue building your brand. You certainly don’t want to see a sudden drop which can signify a potential issue such as less interest in your topic, a competitor taking over some of your rankings or even an algorithmic penalty.
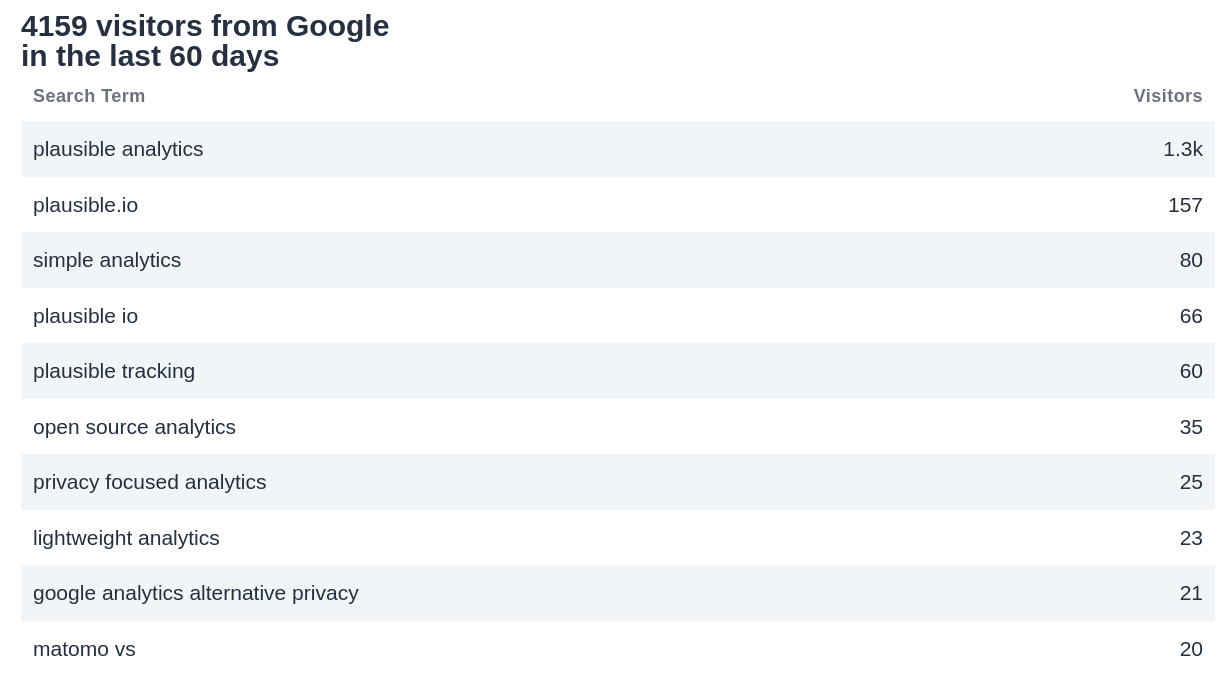
Search queries people find your site with
Plausible Analytics allows you to integrate your Google Search Console account so you can see all the search queries that Google sends you traffic with. This tells you whether you’re ranking for any relevant keyword phrases and how your SEO strategy performs.
Entry pages from search engines
It’s useful to understand which pages Google (or another search engine) considers important to rank and send you traffic to. This can help you analyze your efforts to understand what works and what doesn’t which can help you optimize your future content calendar.
The number of branded searches
The number of searches for branded keywords such as your startup’s name or your URL. Tracking the trend of these keywords is useful to understand whether your marketing efforts are working in a more indirect way. You may see a spike in branded search traffic thanks to a guest post on a big site or thanks to you being a guest on a popular podcast.
Top Pages
Shows the most viewed pages of your site. On many websites, the home page is not necessarily the most visited and the popular page. Knowing the pages that people visit the most is useful in many ways.
Understanding the interest around your product’s benefits
For instance, we’ve published different product pages that explain in detail how Plausible Analytics is built around use-cases where we believe Google Analytics is not the ideal solution for some website owners. These are things such as website speed, simplicity and privacy regulations. We can now look into our stats to see which of these “benefits” is most interesting to the visitors of our site.
Analyzing your content marketing efforts
Top pages is also one of the main metrics for your content marketing efforts. It takes a lot of time and effort to produce a blog post so knowing which blog posts have had a bigger impact than others is an insightful and actionable stat. It can help you decide which topics to explore even further.
Analyzing in-product usage and retention
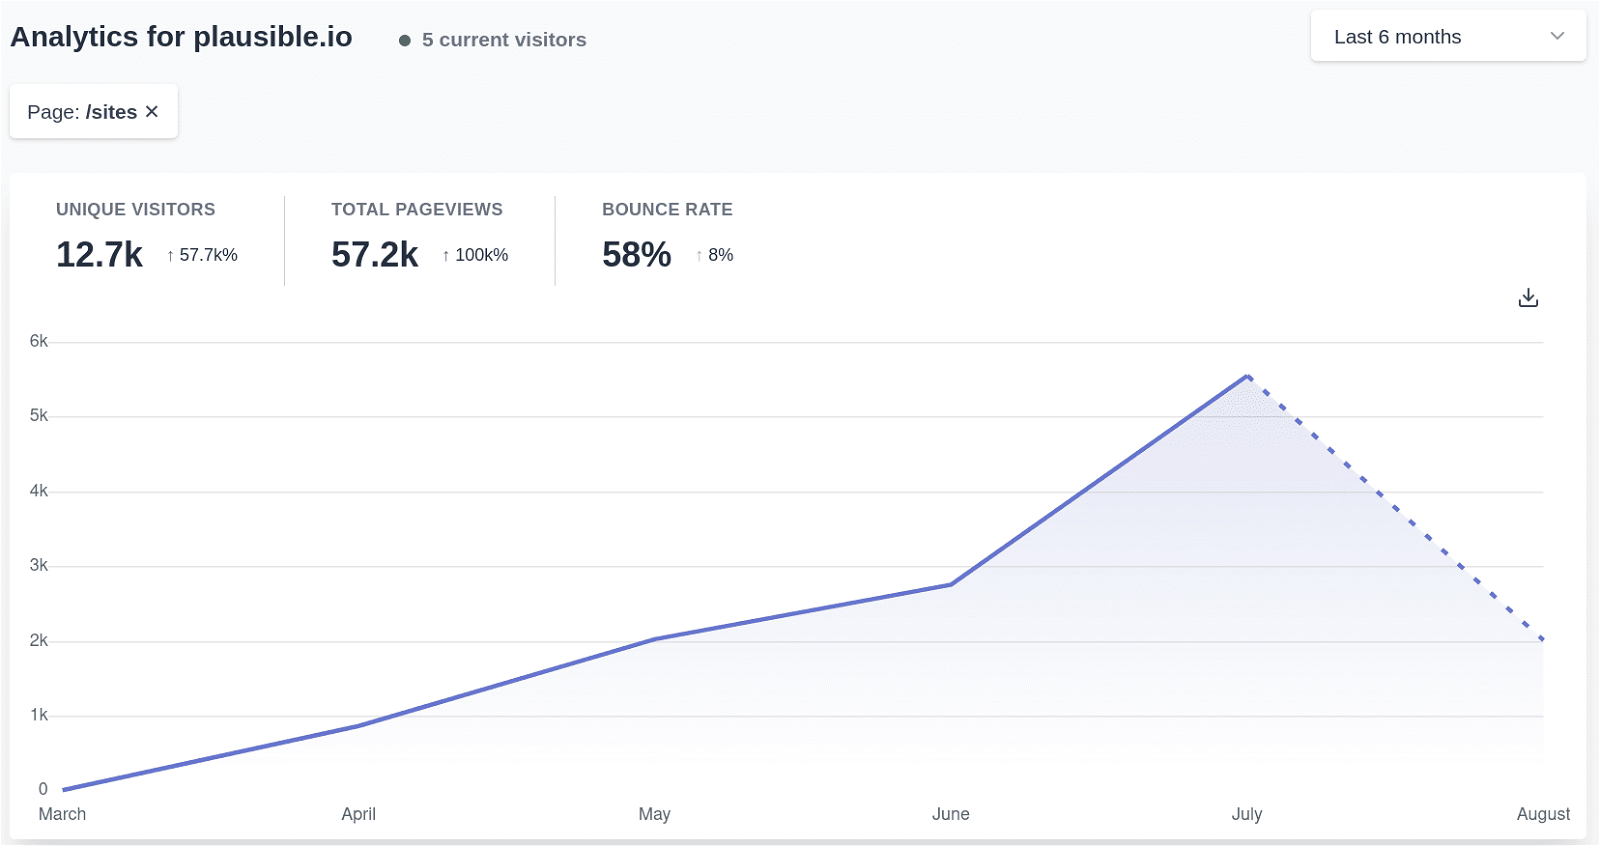
Top pages report can also help analyze your in-product usage in terms of activation and retention. We don’t do any in-depth analysis of our product usage such as heatmaps and behavioral analytics but we do keep an eye on the aggregate usage of specific pages:
- /sites is our landing page for logged in users
- /settings is our settings page for logged in users
- /sites/new is where our users go to add a new domain name to Plausible
- /billing/upgrade is where our users go if they want to sign up for a paid subscription
As mentioned earlier, day to day fluctuations in visits to a specific page are normal but when looked at a period of several months, we do like to see these numbers grow. Here’s how the numbers look like for our logged in users over the last six months.
Goals
You can use goals to track desired actions people take on your site. Goals can be based on people visiting a particular page or triggering a particular event such as subscribing to a newsletter or signing up for an account.
For our own needs, we have set up three different goals:
- Visiting the register page. This is useful in telling us how many of the website visitors end on our registration page, which referral sources drive the most traffic to it and which internal pages do the same
- Registering for a trial account. This is useful in knowing the number of trial accounts registered but also to look at the health of the register page itself. If there’s a sudden drop in the conversion rate on the register page, it might mean that there are some issues that need to be reviewed
- Subscribing to the newsletter. This is useful to know how many people decide to hear from us. We can, for instance, see which referral sources and individual blog posts have had the biggest impact in getting people to subscribe to the newsletter
Conversions by referral source
This is another report that we pay close attention to. There are top referral sources of overall website traffic but there are also referral sources that send traffic that converts. And these are not necessarily the same sources.
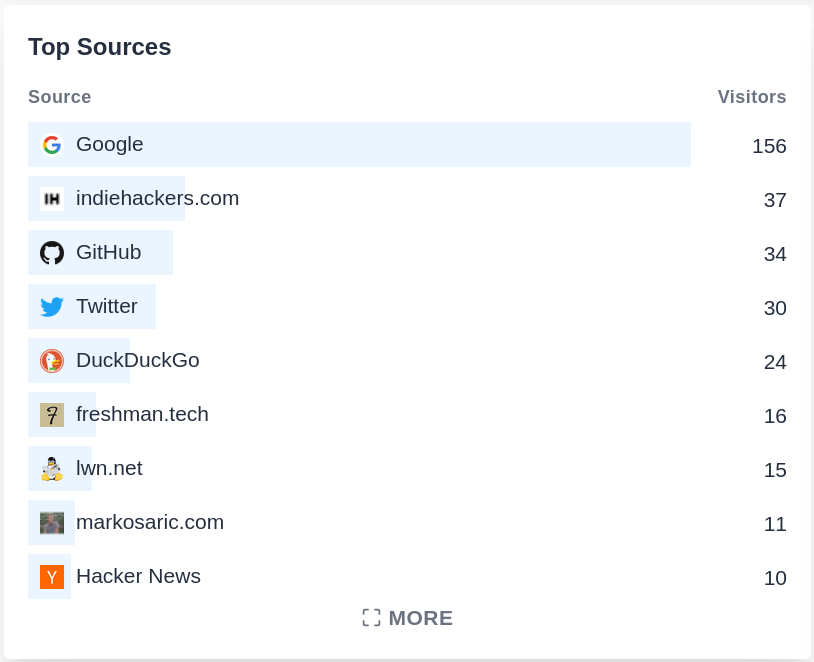
So it’s worth looking at conversions by referral source too. Looking at our own trial signups goal conversions, the 8 of the top 10 referral sources of traffic are also in the top 10 sources of conversions too but their order is much different.
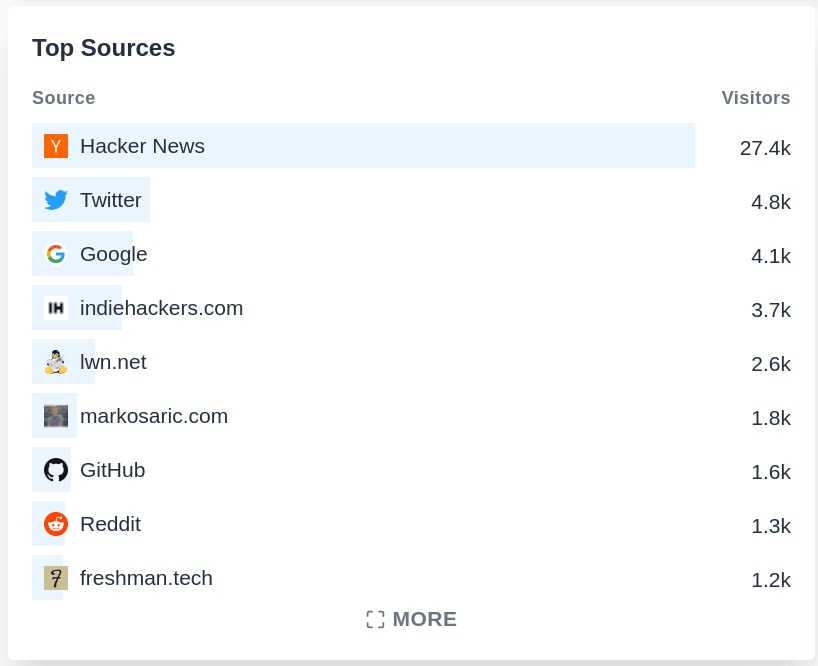
Hacker News is our top referral source of traffic by far but comes in 10th place for conversions. Google organic search is the third highest source of traffic but comes on the strongest by far in conversions.
This report gives you an addition layer and more depth to analyze your efforts which can then help you optimize your strategy for the future.
Other web analytics metrics definitions
This post features all the metrics Plausible Analytics supports on our dashboard and their definitions too. We plan to keep this page up to date with all the latest changes and additions.
Total Pageviews
The total number of times your pages were loaded by your visitors.
Bounce Rate
The percentage of visitors with a single page view. A visitor “bounces” away and leaves your site after only viewing a single page.
This is a useful metric to judge the quality of the individual pages on your site. You can review pages with a high bounce rate where many visitors leave your site to decide whether that is expected behavior and whether there are actions you can take to improve the particular page and reduce the number of bounces.
Note that a particular page having a high bounce rate doesn’t automatically mean that it is a negative thing that needs to be acted on. Depending on the context, some visitors bounce because they get what they came for and have no need to explore further.
Bounce rate is also useful when judging the quality of a referral source and can help you decide which marketing actions to continue being focused on and which to stop.
Visit Duration
How long time visitors spend on your site. It only shows people who visit more than one page. For those who visit one page only we default to 0 seconds.
Visit duration is another metric that can help you measure the quality of your site and the quality of a referral source. It can be nicely combined with the bounce rate.
Current Visitors
How many people are on your site right now. This includes all visitors who have loaded a page in the last 5 minutes.
In Plausible Analytics, you can click on the number of current visitors to enter the Realtime dashboard and see what pages current visitors are viewing, referral sources that sent them to your site, completed goals and other details.
This is especially useful in those cases where you have a spike in traffic and want to understand what that is caused by. When I see an unusually high number of active visitors on site, I enter the realtime view and look at the referral sources and the top pages.
This can help identify when your content was shared by an influential person in social media, when you have a new link pointing to your site or when your post has been submitted to a large aggregator or a niche forum. Then you can go and join the conversion wherever it is taking place.
Entry Pages
Shows the first page people view on your site.
Direct / None
This referral source includes visitors who typed your URL into their browser, clicked a link in an email or a mobile app. It also includes other visitors who were missing a referrer header. For many websites, “Direct / None” stands at the top of their referral sources.
How to minimize the amount of traffic without referrals
To minimize the amount of traffic that falls within the “Direct / None” category, you can add these special query parameters to your links. Plausible Analytics supports the following parameters:
- yourdomain.com?ref=Newsletter
- yourdomain.com?source=Newsletter
- yourdomain.com?utm_source=Newsletter
For any clicks on any of the above links, “Newsletter” would be listed as a referral source in your Plausible Analytics dashboard. It is a good practice to tag your links where the referrer header is not sent. Emails, newsletters, chat, messaging applications, particular websites and communities and so on.
When a query parameter is present in the link it takes priority. When someone lands on your website without the special query parameter defined, Plausible Analytics falls back to the referrer header.
Countries
Shows the list of countries your visitors are based in.
Screen Size
Shows the width of the screens used by your visitors. We measure the width of the browser window where your site is actually rendered rather than the full screen width.
- Everything under 576px screen size is considered a mobile device
- Everything from 576px up to 992px screen size is considered a tablet
- Everything from 992px up to 1440px is considered a laptop
- Everything above 1440px is considered a desktop
Metrics are shown as a percentage of all visitors.
Browser
Shows the browsers used by your visitors. We only show the brand of the browser and don’t include the version number or any other details. Metrics are shown as a percentage of all visitors.
Operating System
Shows the operating systems used by your visitors. We only show the brand of the operating system and don’t include the version number or any other details. Metrics are shown as a percentage of all visitors.
Converted Visitors
When a visitor converts for a particular goal they’ll be counted as a converted visitor. If the same goal is completed multiple times by the same visitor, it will only be counted as a single conversion.
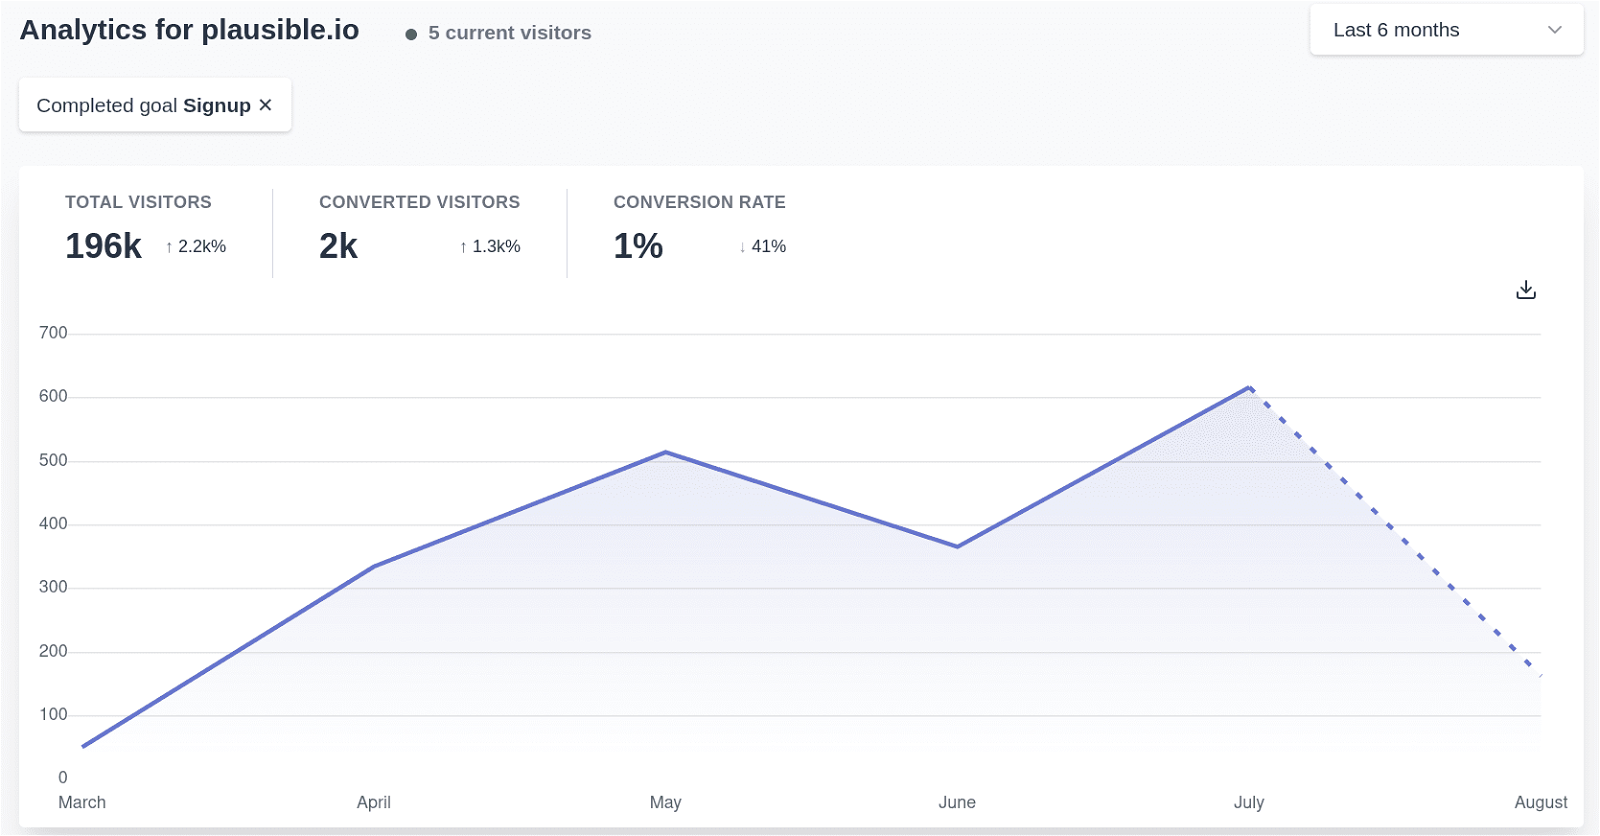
Conversion Rate
The percentage of visitors that take a desired action such as subscribing to a newsletter or signing up for an account. Here’s a look at our trial signups.