Dashboard overview
Plausible Analytics is built with simplicity and speed in mind. You get one dashboard with the essential website stats, easy to use and understand with no training or prior experience. There are no sub-menus and no need to build custom reports.
Here’s what you can discover on your Plausible dashboard. You can also explore our live demo where you can see the actual traffic of our website.
Top Graph
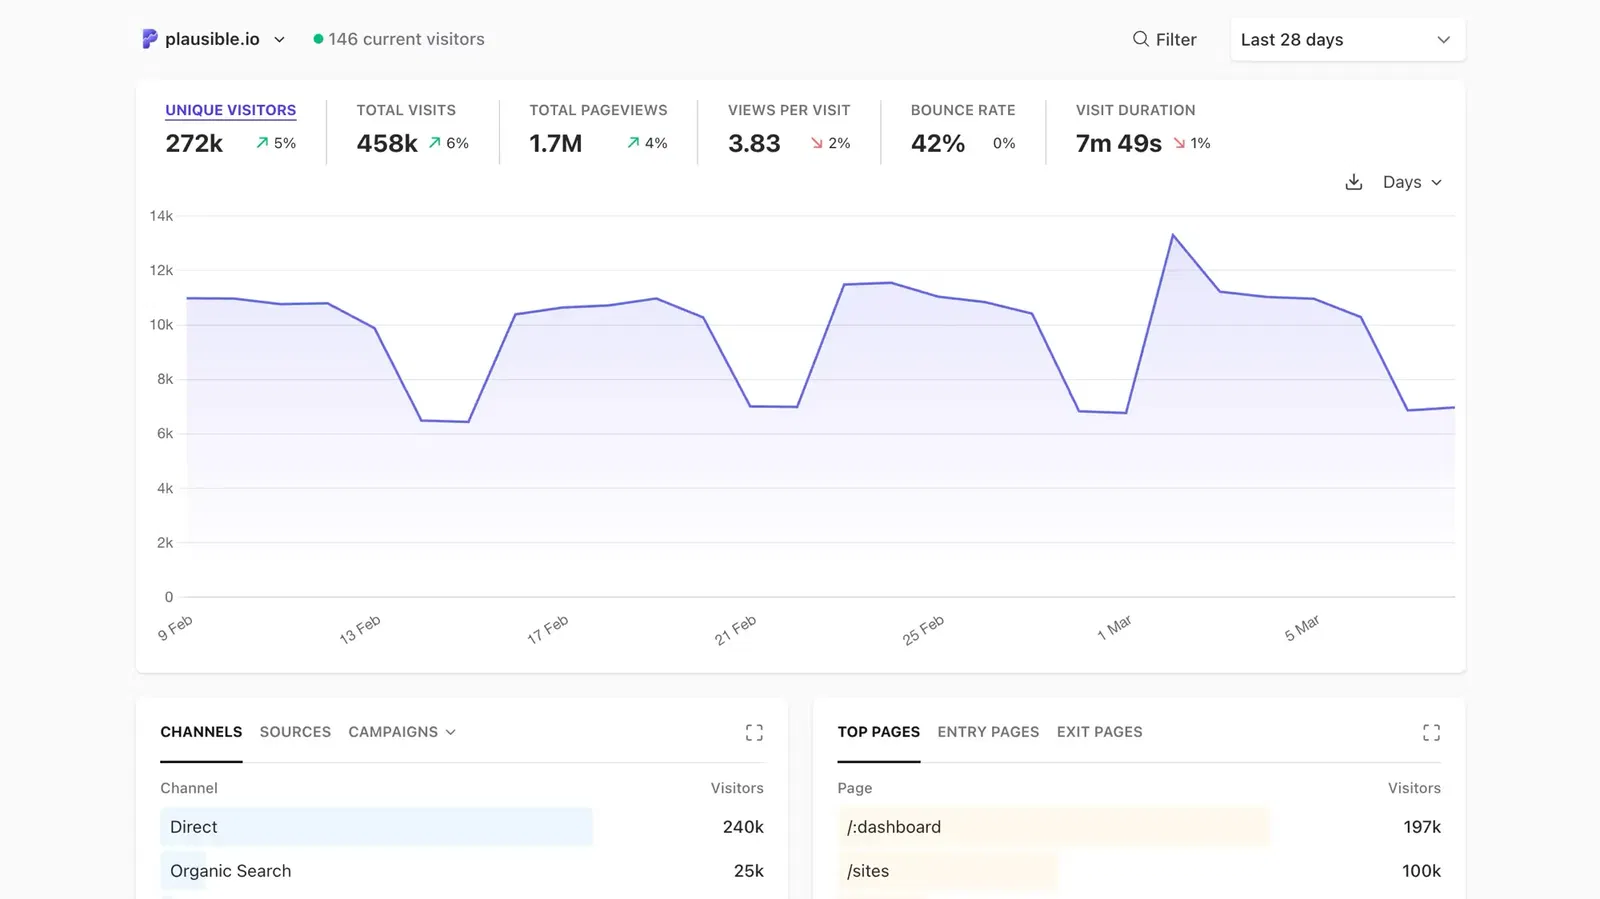
See the number of unique visitors, total visits (sessions), total page views, views per visit, the bounce rate (the percentage of sessions that had one page view only) and the visit duration. You can click on a particular metric to display it in the top graph.
You can choose a different time range that you want to analyze in the date picker in the top right. The dotted line towards the right-end of a graph indicates the current, incomplete day/week/month. The current day is included in the time ranges "Month to date", "Year to date", and "All time." All other time ranges don't include the current day.
The time format (24-hour or 12-hour am/pm) is displayed based on your browser's language setting.
Here you can enter "Site Settings" but also switch to a different pinned site that you have added to your Plausible account
You can also add annotations to the chart to mark important events like a deployment, a campaign launch or an outage. Annotations appear as markers on the chart so you and your team always have context for traffic changes. Learn more about annotations here.
Set a different chart interval
You can set a different unit of time the stats on the chart are grouped by in the options menu (the ⋮ icon in the top right of the chart). Click it and select Graph interval. The available interval options depend on the date range you've selected. For example, if you select "Today", you can display the stats by minute or by hour.
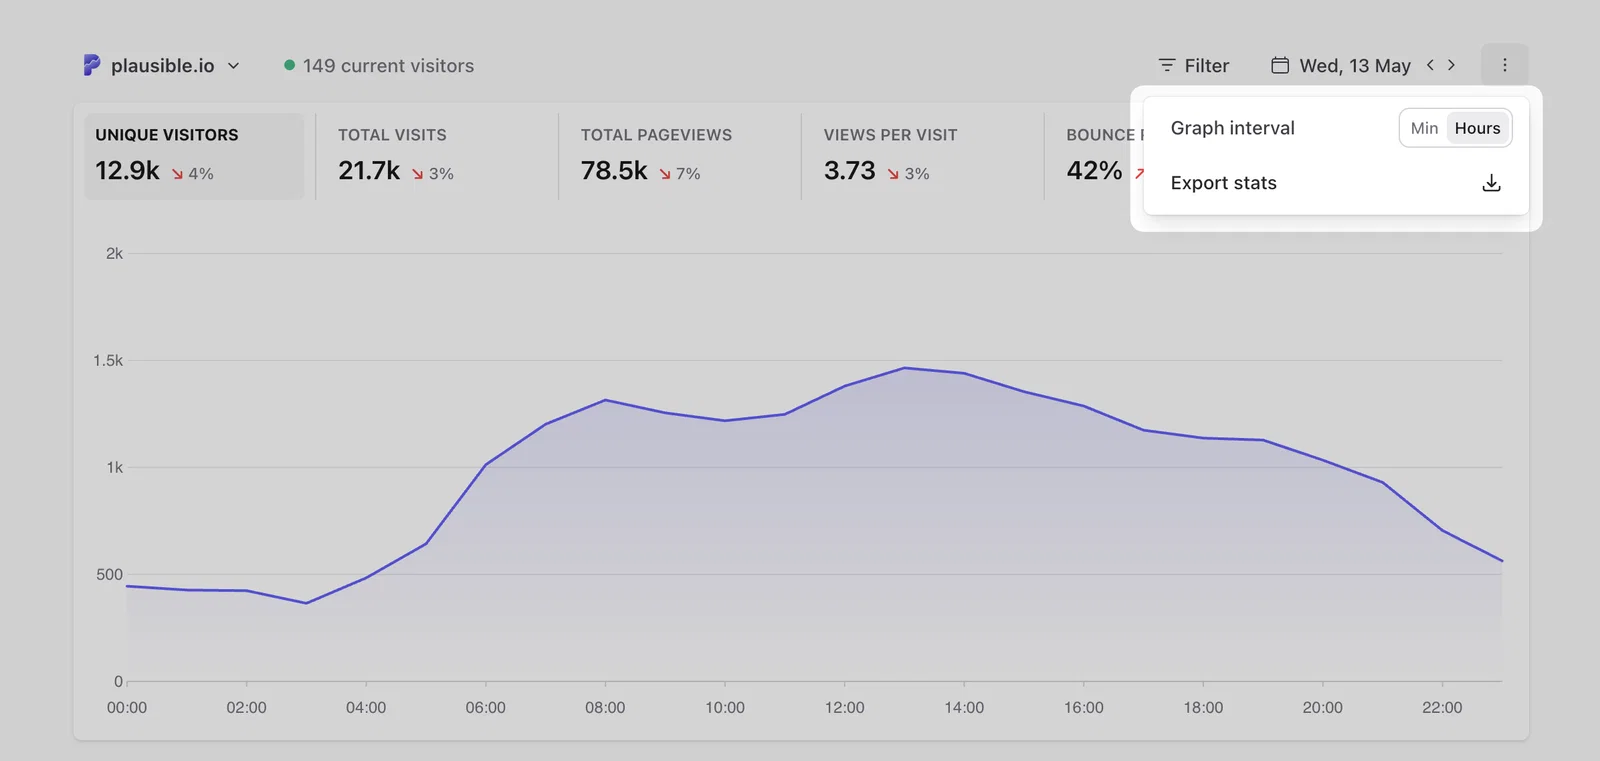
Or if you select "Last 28 days", you can display the stats by day or by week. You can display the stats by days, weeks or months if you choose a wider timeframe.
Compare your stats over time
You can also compare your stats over time. Our comparison feature allows you to analyze stats of a specified date range and compare them to another period. "Previous period", "Year over year" and "Custom period" comparisons are all available. You can also match by day of the week to avoid any discrepancies caused by the weekend.
Select "Compare" in the date picker or press the "X" key on your keyboard to enable the comparison feature. Learn more on how the comparison works here.
Realtime dashboard
By clicking on the number of current visitors (defined as those that visited the site in the last 5 minutes) or by selecting Realtime in the date picker in the top right, you can see the realtime dashboard that tells you what's happening on your site live in that moment.
The realtime dashboard also includes a pageview graph for the last 30 minutes. It's updated every 30 seconds so you don’t have to refresh it to stay up to date.
Learn more about the realtime dashboard here.
Filtering
You can go granular and click on any of the entries in any of the reports to filter your Plausible dashboard by it. You can mix and match filters too. This is an easy way for you to segment your audience. For instance you can drill down to see traffic coming from a specific marketing campaign to a specific landing page over time.
You can also use the Filter button on the top of your dashboard which gives you extra functionality. It allows you to filter the dashboard by multiple sources, countries, pages and more, all at once. You can also search for any metric, exclude segments of your audience and group pages with options such as "is not", "contains" and "does not contain". Learn more about filtering here.
Detailed metrics and Sorting
You can click the expand icon in the top right of any section to get an expanded view and see the full list with additional metrics such as Visitors, Bounce Rate, Visit Duration, Scroll Depth, Unique Conversions, Total Conversions, Conversion Rate and more, depending on the section.
You can sort any report by such performance metrics by clicking on any metric heading to sort and arrange your data in ascending or descending order. See metric definitions for a full list of what each number means.
Sources
See all the acquisition channels and sources of traffic ranked by the number of unique visitors. You can click the expand icon in the top right to see the full list which also includes additional metrics such as the bounce rate and visit duration of the individual referral.
You can use the Campaigns tab to view your campaigns separately from other traffic sources. These are visitors coming from UTM tagged links such as those in your emails, social media or in your paid advertising campaigns. Click on Medium, Source, Campaign, Term and Content to explore these.
UTM parameters and other referral sources are only recorded when they start a new session. Read more about how sources are counted. If your UTM link returns a 202 response but nothing appears in the Campaigns tab, see UTM parameters not appearing in Campaigns.
Top Pages
See all the most visited pages on your site ranked by the number of unique visitors. You can click the expand icon in the top right to see the full list with additional metrics. The number of pageviews, bounce rate, time on page and scroll depth for the individual pages are included too.
You can also get insights into the visitor flow by looking at the Entry pages and Exit pages. Click the expand icon in the top right to see the full list with additional metrics. For Entry pages this includes visit duration for visits that started on a specific page and for Exit pages this includes the exit rate percentage. Read more here.
Locations
See the list of countries, regions and cities your traffic is coming from. You can click the expand icon in the top right to see the full list ranked by the number of visitors. Read more here.
Devices
You can see the device, browser and operating system your visitors are using. Click on the individual browser or operating system to drill down and see browser versions and OS versions too. Read more here.
Goals, properties, funnels and journeys
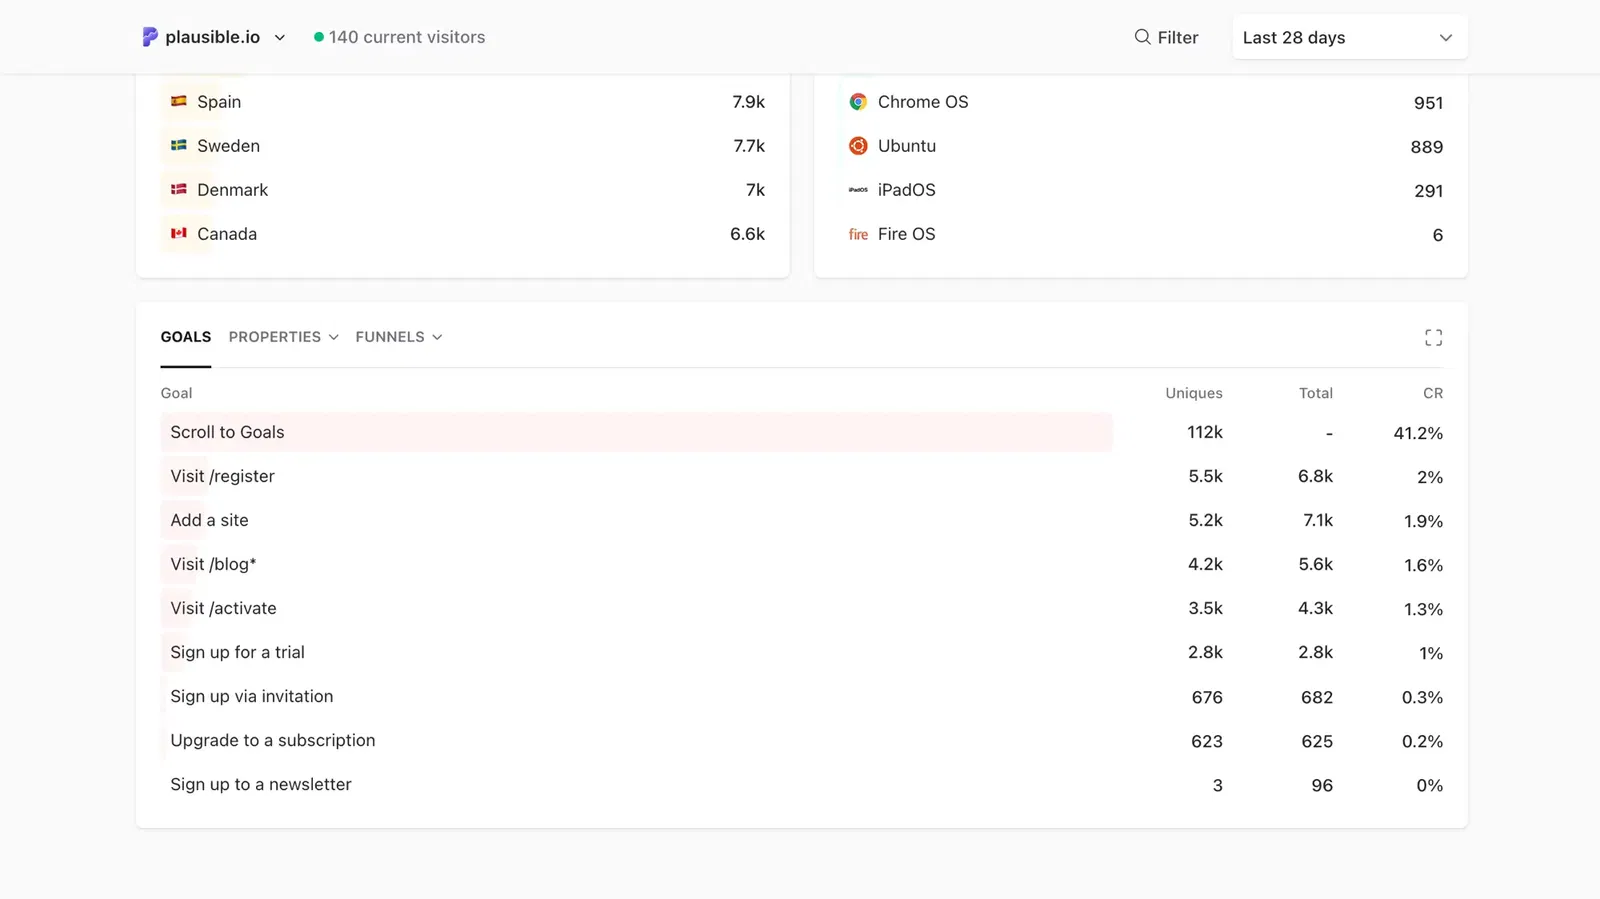
You can track goal conversions to see which pages and referral sources drive signups, purchases, downloads and other actions. Revenue tracking, funnel analysis, form completions, file downloads and more are all available.
The Explore tab sits alongside Goals, Properties and Funnels. Use it to trace the paths visitors take across your site, starting from any page or event and following what they did next. Read more about user journeys.
You can read more about events, properties and funnels here.
You can also use keyboard shortcuts to navigate the dashboard faster.